← Back to resources
blog
Carbon Impact Report 2025: Navigating the Carbon Negative Long-Game

Written by
Sandy Neill
Published
Sandy Neill presents ev.energy’s 2025 Carbon Impact Report — explaining the structural challenges behind our first net-positive year, and setting out our plan to return to net-negative.
At ev.energy, our goal has always been simple: empower every EV driver with smart charging to accelerate the transition to an affordable, zero-carbon energy future. As we’ve expanded into multi-DER orchestration — coordinating EV charging, solar, battery storage, and all flexible loads — we are building the platform to unlock even greater carbon and cost savings for consumers and the grid.
As part of our climate leadership, we are sharing our 2025 Carbon Impact Report. This year’s report addresses a structural challenge we anticipated, explaining the system-level factors behind it, and setting out our plan to address them.
Building on our 2024 Carbon Impact report, this report for 2025 continues to follow the Greenhouse Gas (GHG) Protocol, covering Scopes 1, 2 and 3 with improved physical data coverage.
ev.energy’s 2025 Carbon Impact
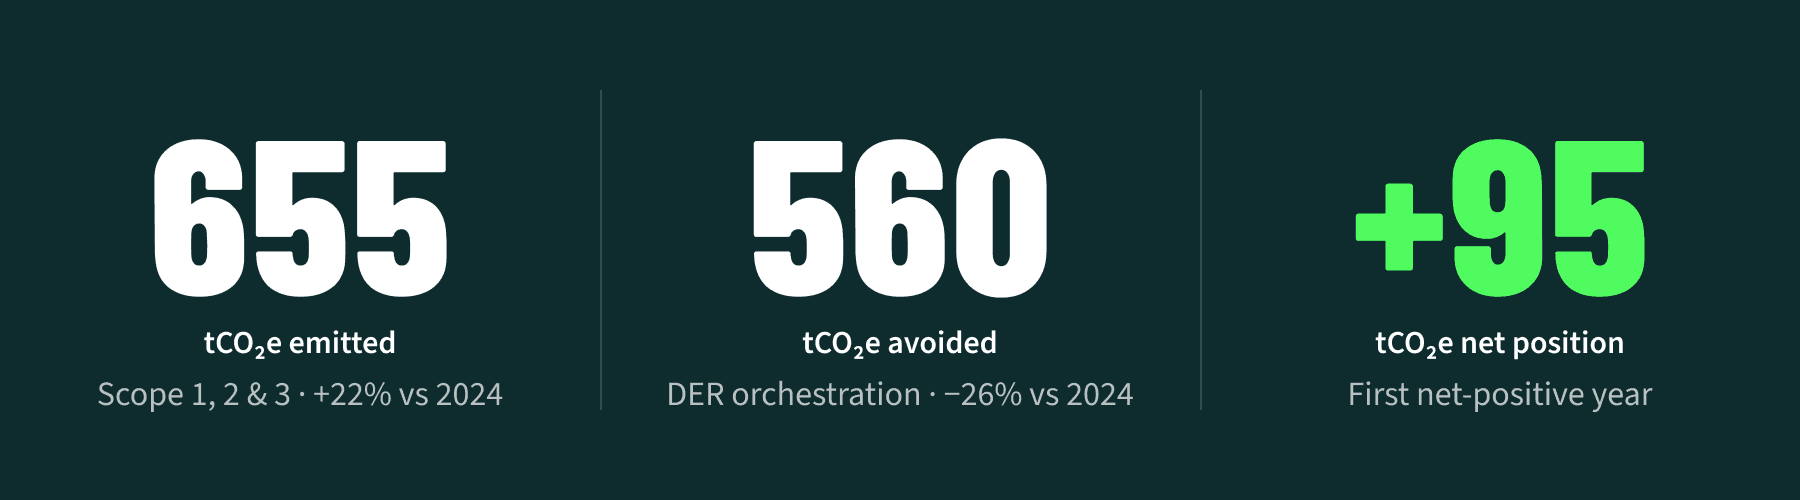
In 2025, ev.energy was a net carbon emitter. Here’s how it breaks down:
655 tonnes of carbon dioxide equivalent (tCO₂e) emitted across Scope 1, 2 and 3 operations
560 tCO₂e avoided through smart charging and DER orchestration on our platform
95 tCO₂e net-positive impact — our first net-positive result since we began reporting in 2022
In 2025, our operations emitted more carbon than our platform saved. We anticipated this challenge: it is the result of leaning into California programs where system-level constraints currently limit carbon avoidance, combined with growth in our digital infrastructure. We have a clear plan to address both.
Understanding the Numbers: Emissions Growth and Carbon Avoidance
1. Why Carbon Avoidance Fell: California and TOU Rate Structures
The largest driver of the decline in carbon avoided is a system-level challenge in some of our California utility partnerships. Time-of-use (TOU) rate structures — designed primarily for affordability — incentivise overnight charging, which is off-peak from a price perspective. However, California’s grid has a unique carbon-intensity profile: overnight hours can carry higher carbon-intensity than daytime hours, which benefit from abundant solar generation. Meanwhile, as the grid gets greener overall, the marginal carbon benefit of shifting charging diminishes, making avoidance harder across all markets.
The core challenge: Affordability is the primary goal of TOU rate structures, and rightly so. But in markets like California, TOU rates can cause secondary peaks and distribution grid challenges. We have been pushing against this for years. We are working with utilities and Community Choice Aggregators (CCAs) of all sizes across California to advocate for — and have the platform to deliver — multi-DER orchestration that follows carbon intensity signals, not only price signals. California utilities are mandated to introduce dynamic rates, which will change this picture. It takes time, but we are well-positioned.
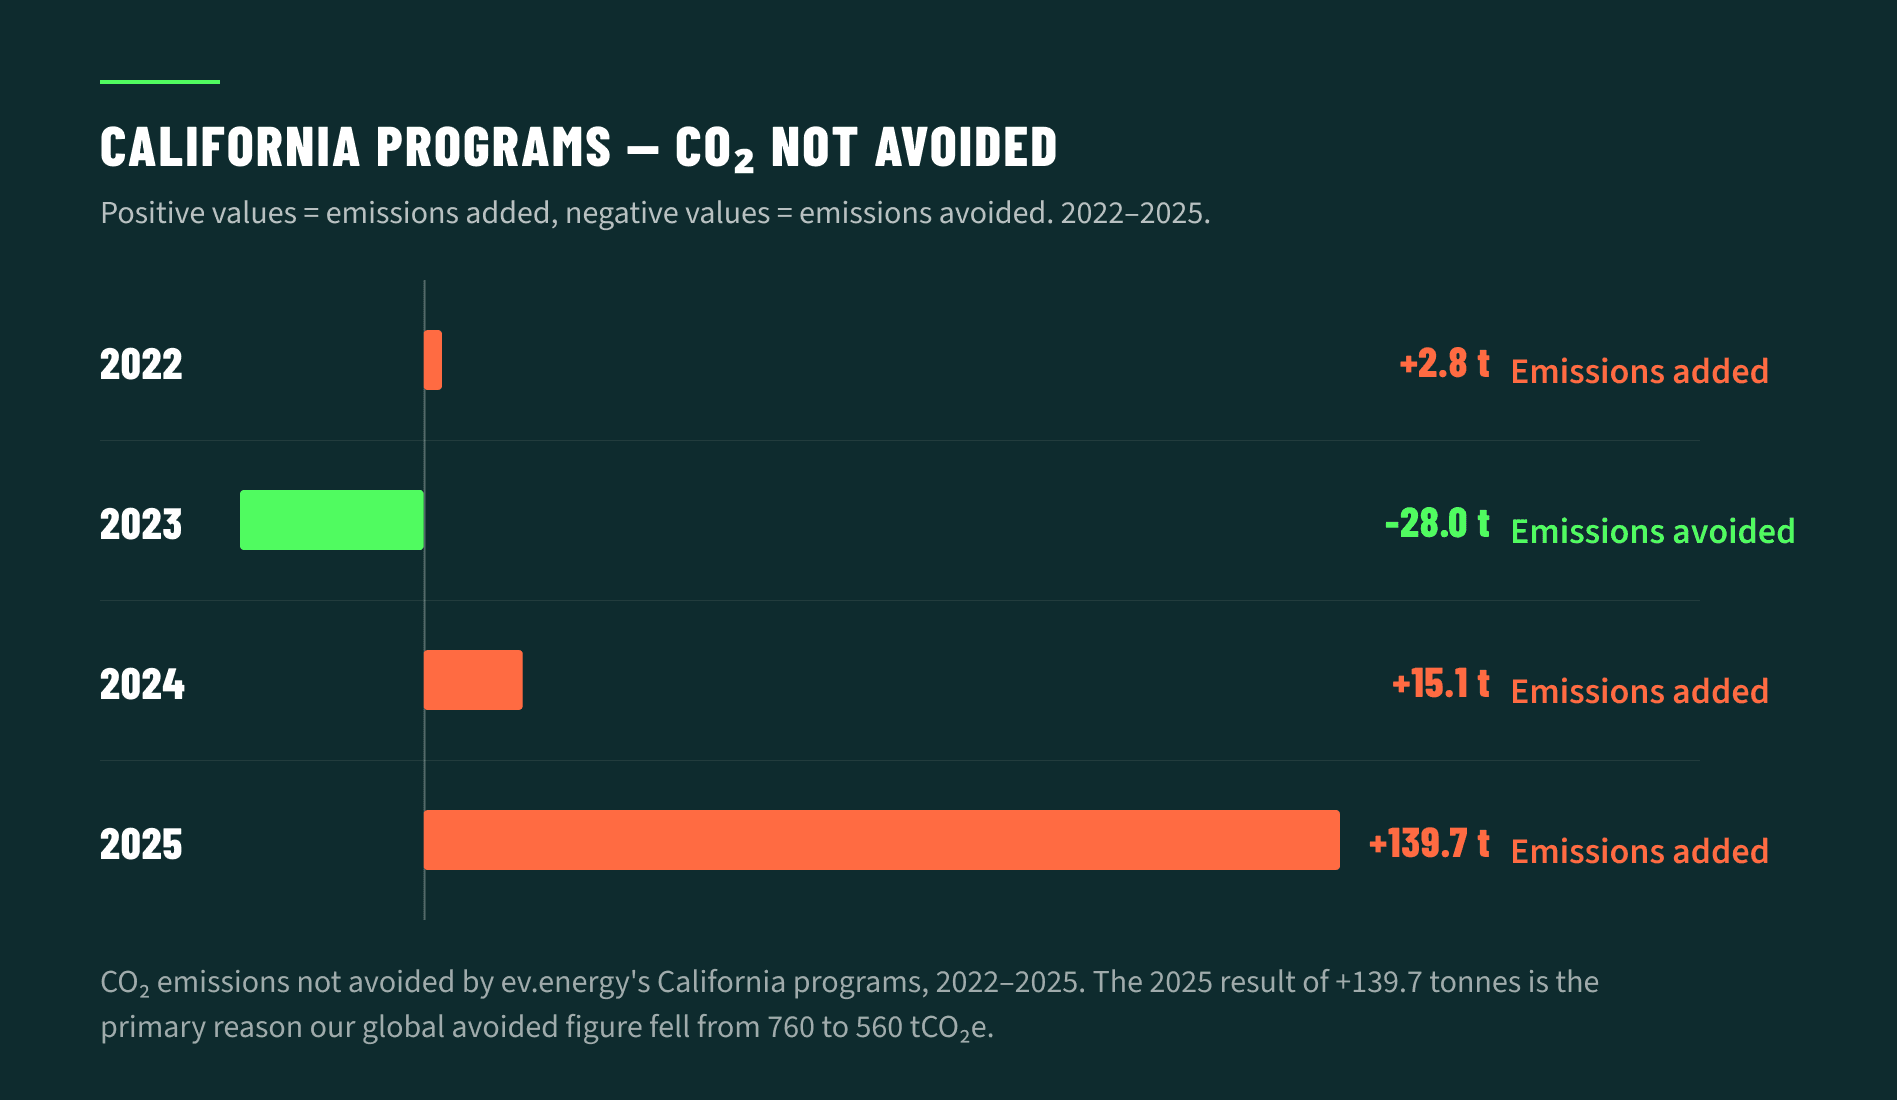
The 2025 result of +139.7 tonnes from California programs is the primary reason our global avoided figure fell from 760 to 560 tCO₂e.
2. Why Our Emissions Grew: Digital Infrastructure Expansion
Our total digital emissions grew 42% to 228 tCO₂e — now our single largest emission category at 35% of our total footprint. This growth reflects the expansion of our resources to match client needs: as we onboarded new utility programs and expanded existing ones, our cloud computing infrastructure and software licensing grew accordingly.
Our cloud computing usage alone accounts for 48 tCO₂e (7.4% of total emissions), with computation representing 77% of that cloud footprint.
We identified this rise in our Q4 2025 internal audit and have already begun taking action to reduce it in 2026.
Our Emission Sources
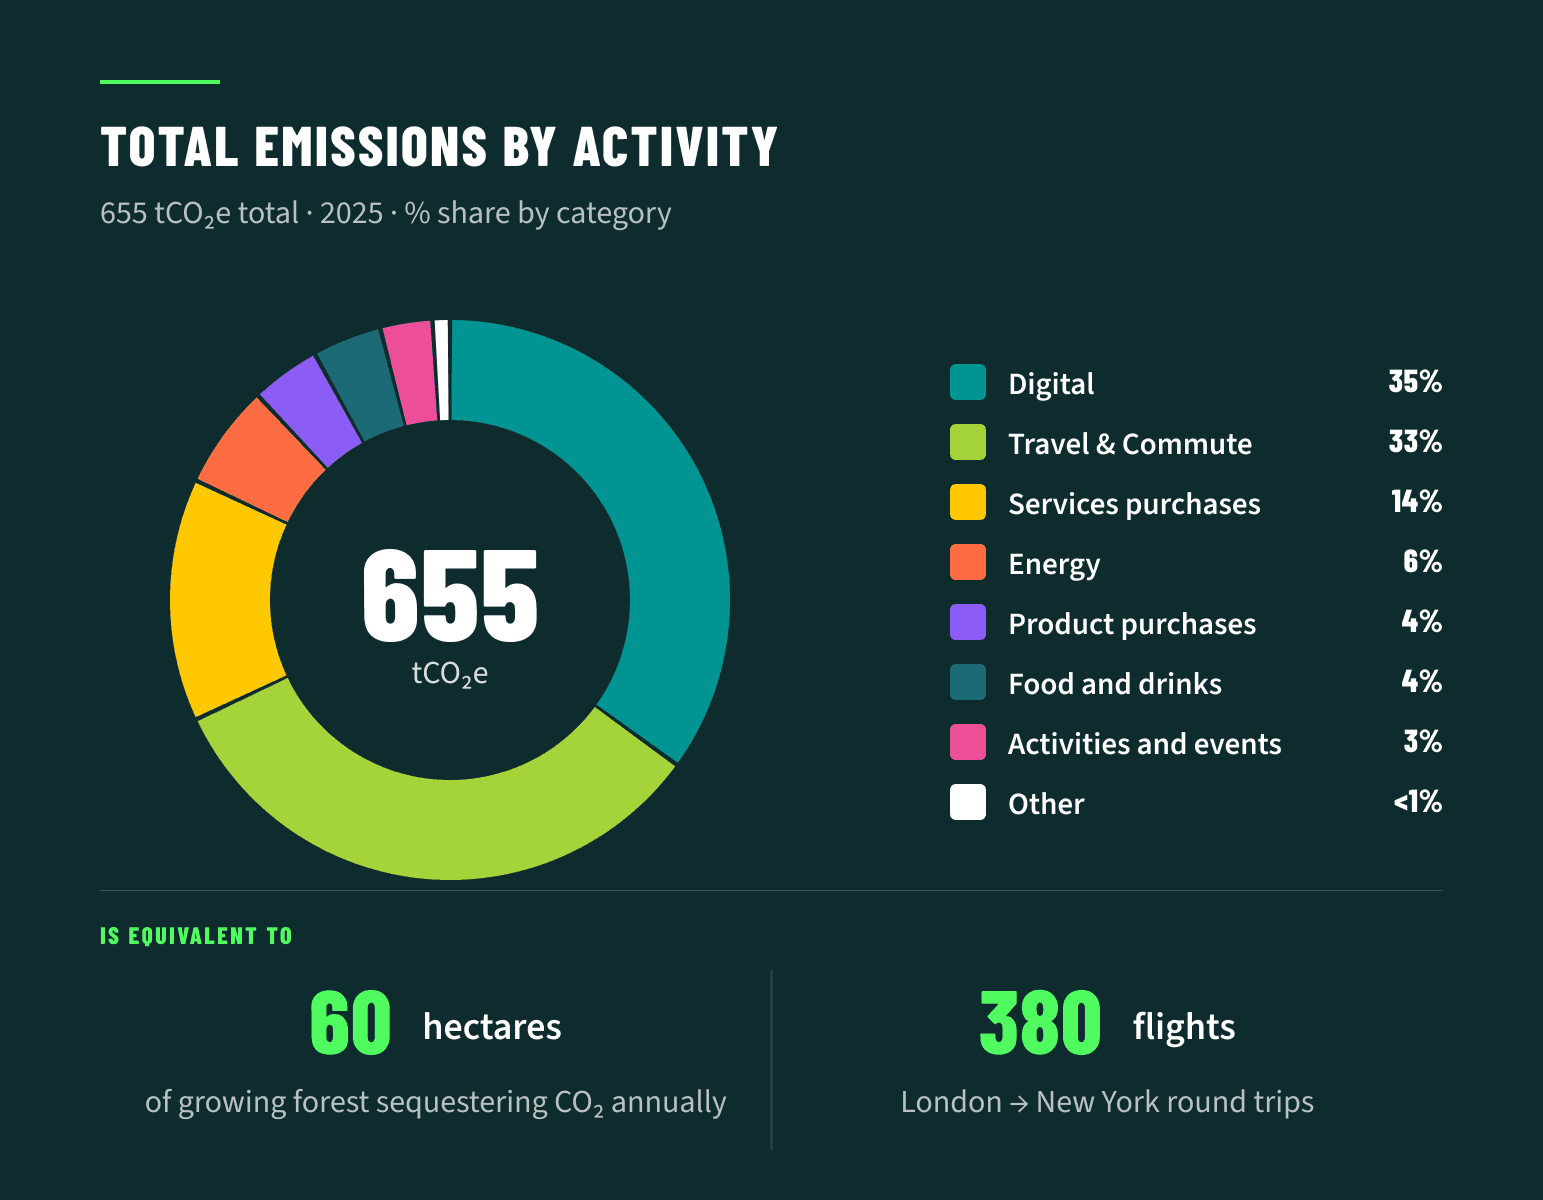
As in 2024, 99% of our emissions are Scope 3 — indirect emissions from our supply chain, purchased services, and digital infrastructure. Scope 1 (direct emissions, <0.1 tCO₂e) and Scope 2 (electricity, 3.9 tCO₂e) together account for less than 1% of our footprint.
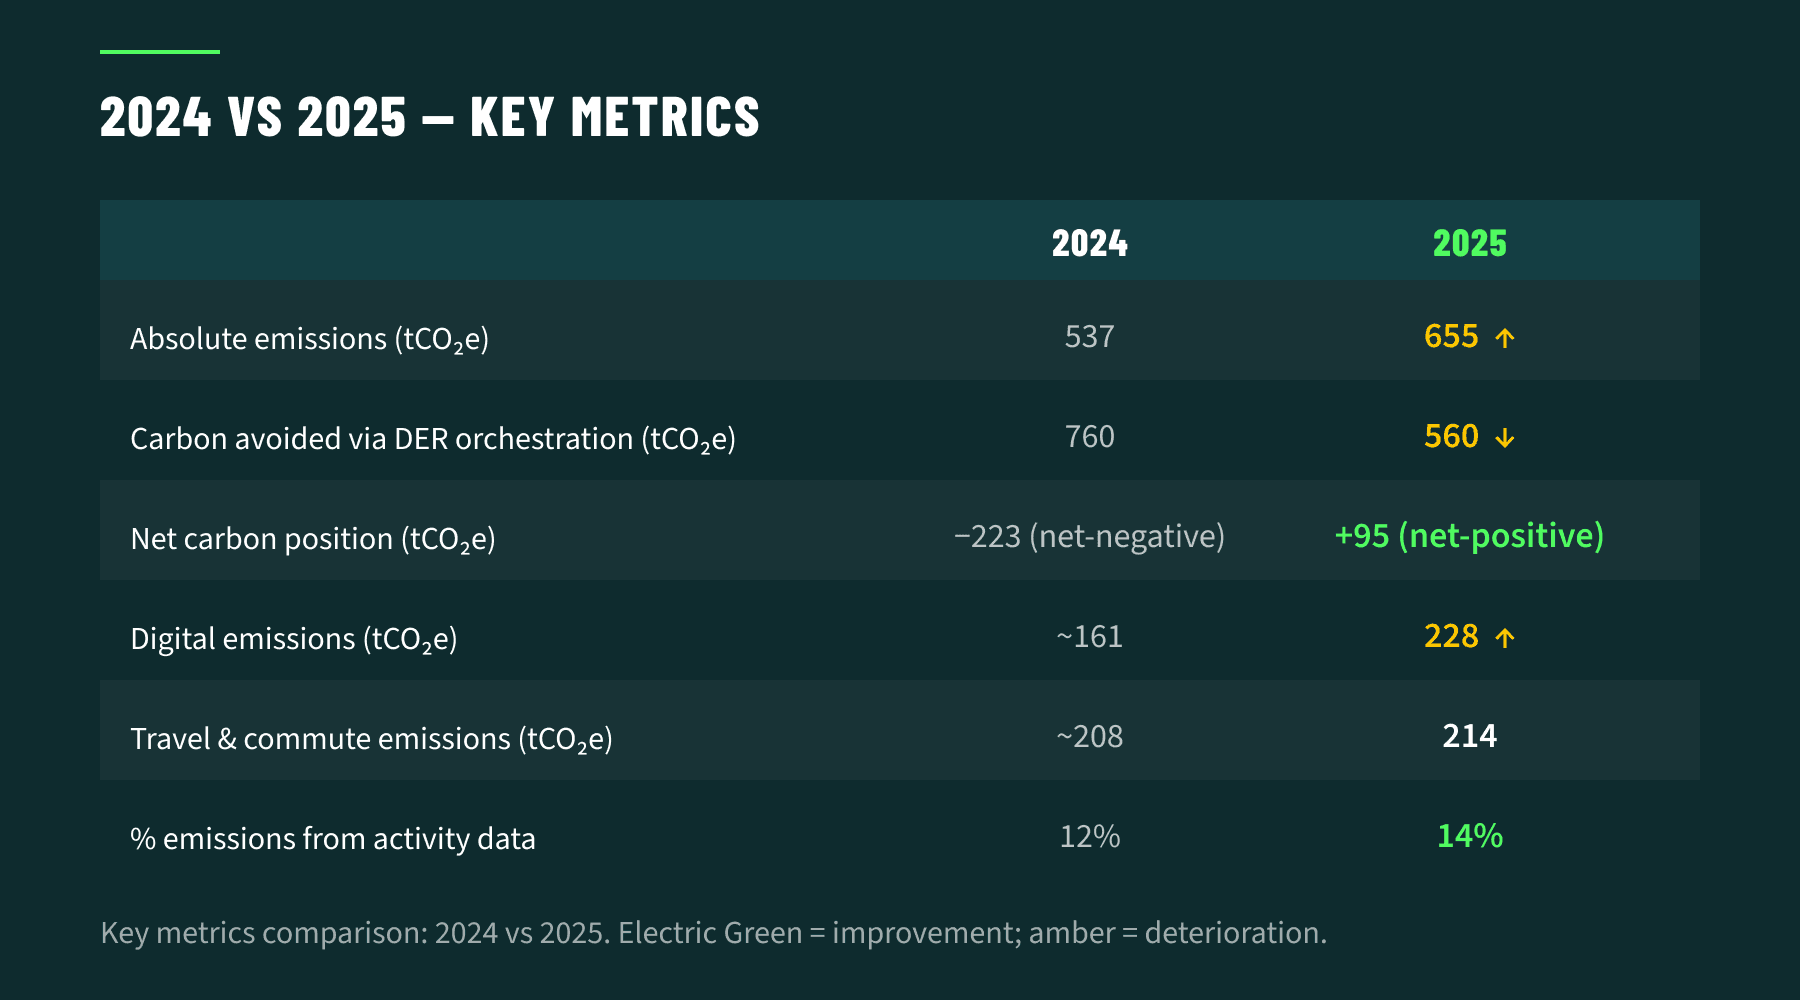
2024 vs 2025: Key Metrics
Carbon Impact Methodology
For the second year, ev.energy collaborated with Greenly, a leading carbon accounting platform, to produce a full-scope GHG assessment based on the GHG Protocol.
Key features of our 2025 methodology:
14% of emissions calculated from physical activity data (e.g. kWh consumed, km travelled, cloud computing usage) — up from 12% in 2024
The remaining 86% calculated using expense-based estimation, mapped to emission factors from ADEME, Exiobase, IEA, eGRID (2023), and UK GHG Conversion Factors (2025)
Emissions categorised across Scopes 1, 2 and 3, covering everything from cloud usage to employee travel, food, and procurement
Assessment covers January to December 2025 for ev.energy under operational control, using a location-based approach and GWP 100 (Global Warming Potential over a 100-year horizon)
This improved accuracy enables a more targeted and actionable climate strategy, while ensuring alignment with emerging sustainability disclosure frameworks, including the EU’s Corporate Sustainability Reporting Directive (CSRD).
Further Achievements and Initiatives
Despite the net-positive result, 2025 saw meaningful progress on our sustainability agenda:
Greenly Bronze Climate Strategy Rating — placed in the top 30% of companies assessed globally, with particular strength in ‘Reduce’ (15/50) and ‘Measure’ (11/40)
Responsible Supply Chain Management Policy formally launched, with initial supplier climate maturity assessments begun for our top service providers
Cloud carbon audit completed in Q4 2025, identifying inefficiencies in our tech stack; reduction actions began in Q1 2026
Travel emissions held near flat (+3% absolute) despite revenue more than doubling, reflecting continued remote-first working and improved travel policies
Employee volunteering and engagement — continued internal climate education and engagement programs throughout the year
What’s Next: Our Path Back to Net-Negative
This is unfortunate, but we are playing the long game. We have a plan, and we are working with utilities and industry globally to achieve it. To meet the Paris Agreement’s implied target of a 6.7% annual reduction, ev.energy needs to cut emissions by approximately 44 tCO₂e per year. In parallel, we need to grow our platform’s carbon avoidance back above our operational footprint.
Our priorities for 2026 include:
Working with our California partners to explore program structures so that dispatch logic follows carbon intensity signals, not only price signals. Initial pilots targeted for H2 2026.
Targeting a significant reduction in digital emissions through cloud right-sizing, idle VM elimination, software licence rationalisation, and migrating workloads to lower-carbon cloud computing regions where possible
Expanding our use of supplier-specific emission factors, particularly for our largest service categories (banks, insurance, intellectual services)
Growing the number of Distributed Energy Resources on our platform to increase carbon avoided through smart charging and intelligent orchestration
Exploring a science-based reduction target, aligned with the Paris Agreement, with public annual progress reporting
Increasing physical data coverage of emissions, enabling more precise target-setting and verified reduction tracking
Net-negative is our baseline, not a bonus. We built this company to avoid carbon, not just measure it. DER orchestration, done right, means cheaper rates for everyone and a cleaner grid. We will return to a net-negative status, and we will be transparent about our progress every step of the way.
Want to be part of a clean, affordable energy future? Discover ev.energy’s intelligent DER orchestration platform or check out our open roles.

